Free Shipping
on orders over $150.00
$120.00
$150.00
Add $30.00 more for free shipping!
-
×
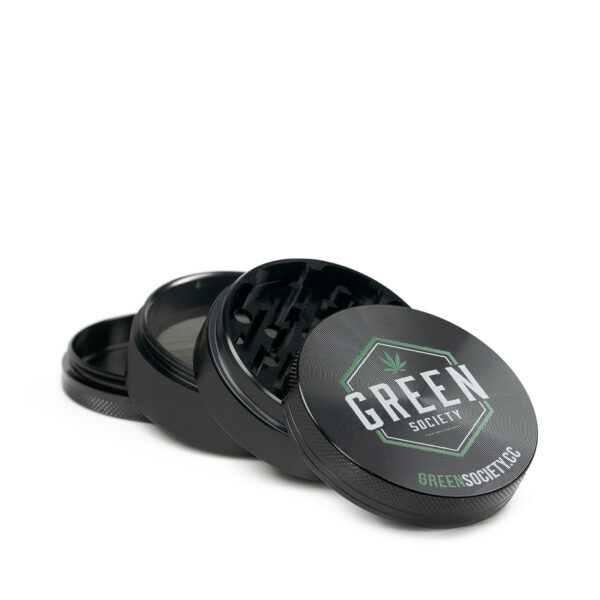 Green Society Herb Grinder
$40.00
Green Society Herb Grinder
$40.00

TL;DR:
- THC potency indicates the maximum psychoactive potential based on a calculation that assumes full conversion from THC-A, although real absorption is usually lower.
- Consumers should review full lab analysis reports, including terpene profiles and contaminants, instead of relying solely on the percentage label.
THC potency is defined as the concentration of psychoactive tetrahydrocannabinol (THC) in a cannabis product, expressed as a percentage of total weight. That number on the label shapes your experience, but it tells only part of the story. Understanding THC potency means knowing how that figure is calculated, what it leaves out, and why two products with identical percentages can feel completely different. This guide gives you the full picture so you can make confident, informed choices whether you use cannabis for recreation or medicinal purposes.
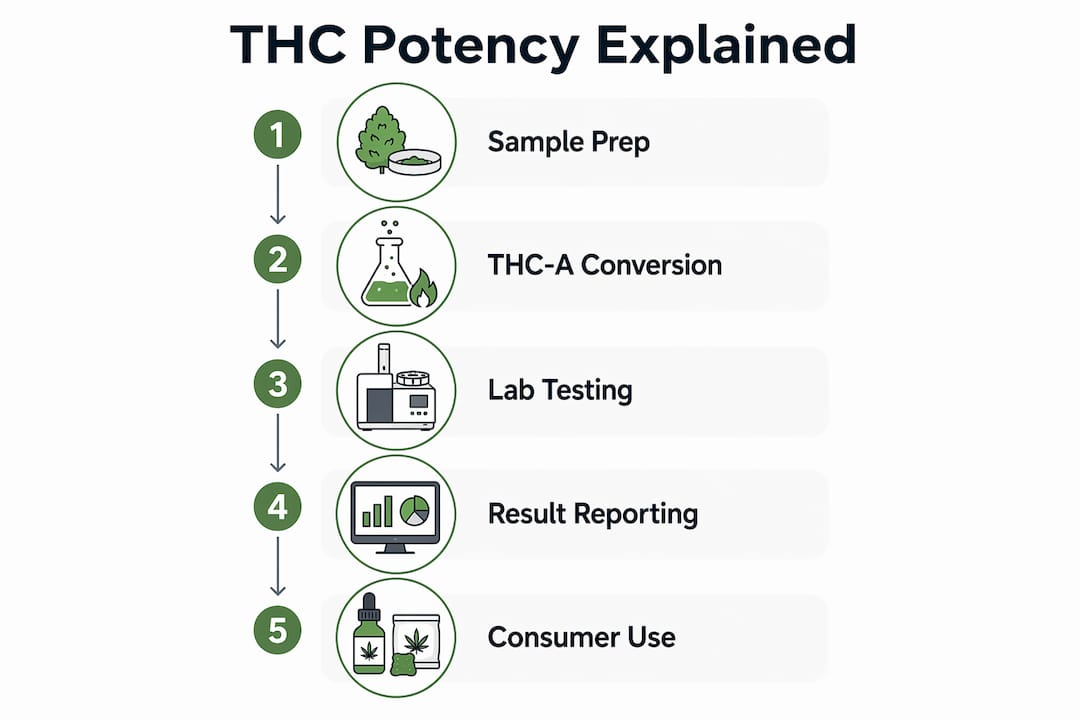
THC potency is calculated using a specific chemical formula, not a simple measurement of active THC alone. Raw cannabis flower contains mostly THC-A, a non-psychoactive acid. Heat converts THC-A into active THC through a process called decarboxylation. Labs use the formula Total THC = THC + (THC-A × 0.877) to estimate the maximum psychoactive potential of a product.
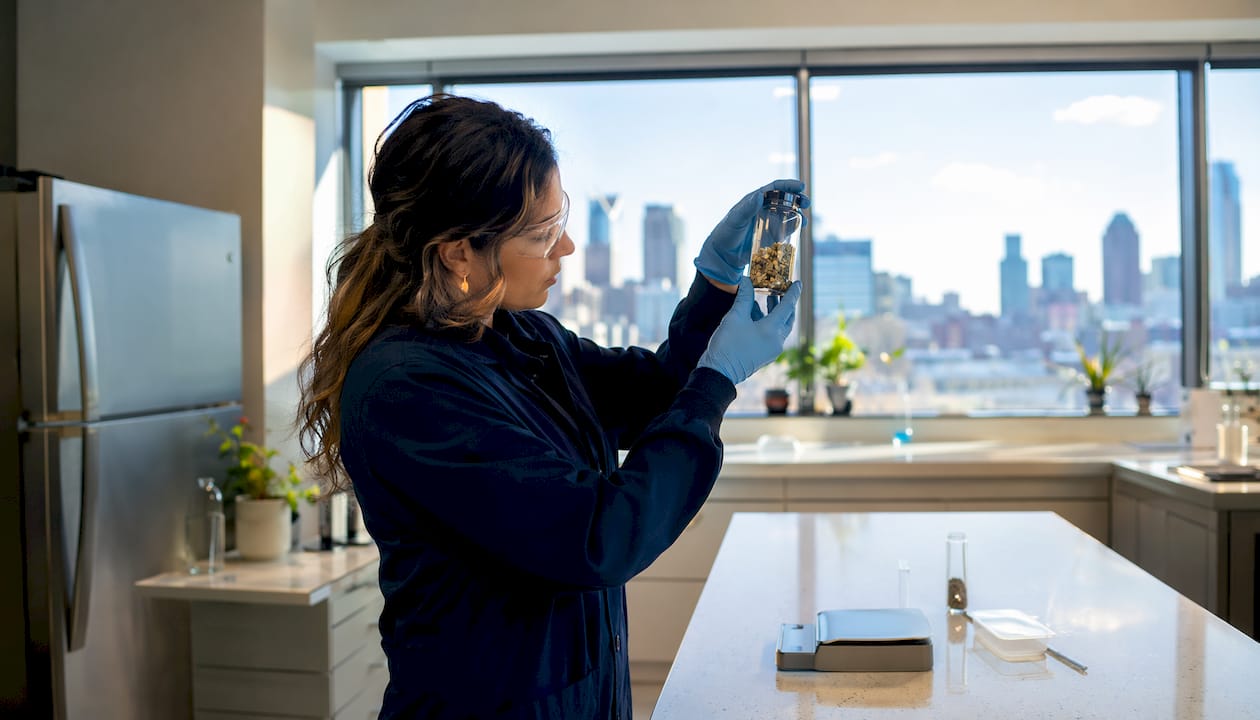
The critical word is “maximum.” Total THC on labels assumes 100% efficient conversion from THC-A to active THC, which rarely happens in practice. Smoking, vaping, and cooking all convert THC-A at different rates. The actual amount of active THC you absorb is nearly always lower than the label suggests.
Lab testing adds another layer of complexity. Significant variability exists when the same cannabis sample is tested across different laboratories, with results differing by 5–10 percentage points. That gap comes from differences in equipment calibration, sample preparation, and which part of the plant is tested.
A practice called lab shopping makes this worse. Producers sometimes select labs that consistently report higher numbers, or submit only their best samples for testing. The result is that labels can overstate real-world potency.
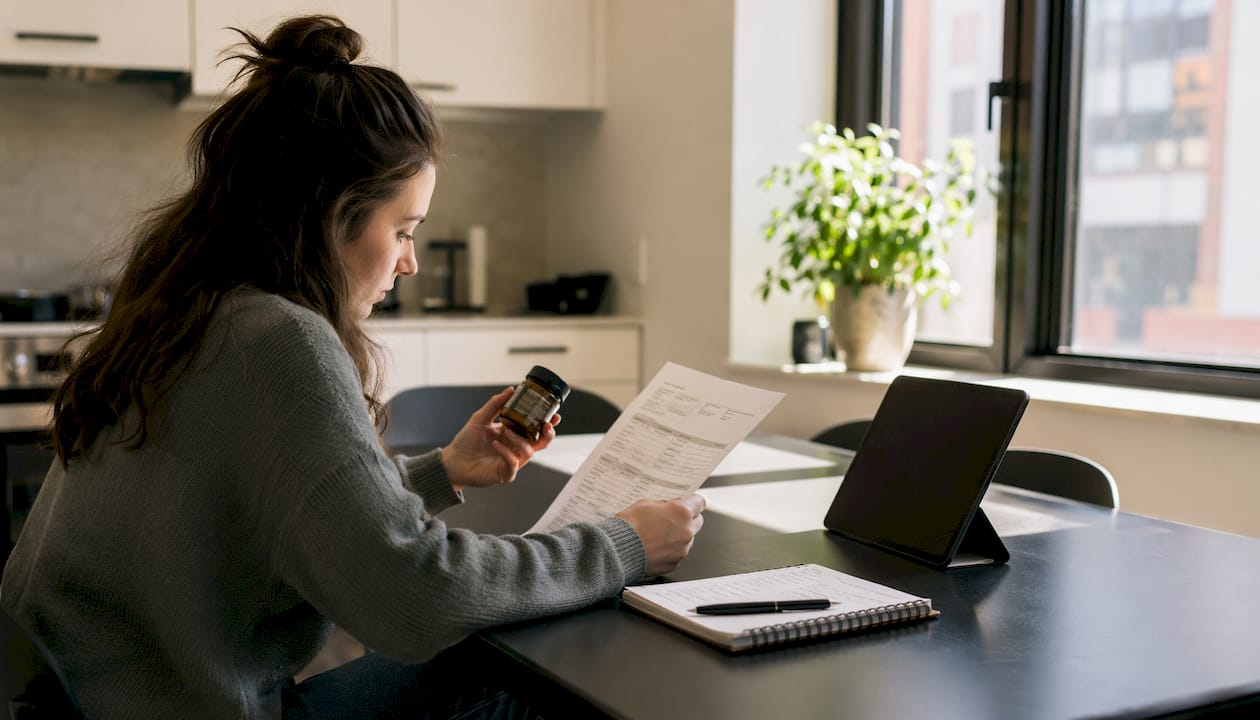
What to look for on a Certificate of Analysis (COA):
Pro Tip: Always request or scan the QR code for a product’s COA before purchasing. A reputable retailer makes this document easy to find. If it is not available, treat the potency label with extra scepticism.
THC produces what pharmacologists call a biphasic response. Low doses promote relaxation and mild euphoria, while higher doses can trigger anxiety, paranoia, and discomfort, particularly in people with low tolerance. Chasing a higher percentage does not guarantee a better experience. It often produces the opposite.
The research on this is striking. Consumers using 16% and 24% THC flower report similar levels of intoxication and comparable blood THC concentrations. Your physiology and how you self-titrate matter far more than the number on the package.
“THC percentage is a starting point, not a destination. The entourage effect, your individual tolerance, and your consumption method collectively determine what you actually feel. A 30% THC flower with a depleted terpene profile can feel flat compared to a 18% flower with a rich, intact terpene content.”
The entourage effect, documented in the British Journal of Pharmacology by researcher Ethan Russo in 2011, describes how cannabinoids and terpenes work together to shape the overall cannabis experience. THC percentage alone is a poor predictor of that experience.
Individual factors that shape how you respond to any given potency level include:
Understanding how THC differs from CBD also helps clarify why potency discussions focus specifically on THC rather than total cannabinoid content.
Reading a cannabis label well is a skill, and it starts with knowing what to prioritise. The THC percentage is the most visible number, but it should not be the only one you consider.
| Experience level | Suggested THC range | Notes |
|---|---|---|
| New or infrequent users | 10–15% | Lower risk of adverse effects; easier to self-titrate |
| Moderate users | 15–22% | Familiar territory for most recreational consumers |
| Experienced users | 22–30% | Higher tolerance required; monitor for diminishing returns |
| Medicinal focus | Varies | CBD:THC ratio often more relevant than THC alone |
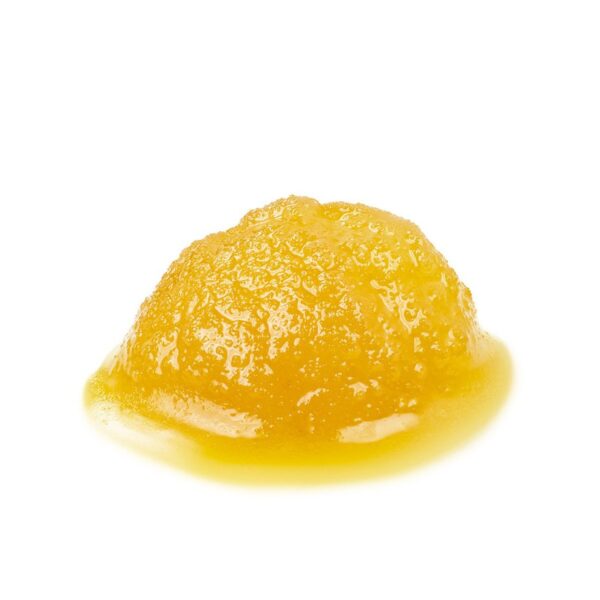
Pro Tip: If you are switching from flower to concentrates, do not apply the same dosing logic. Cannabis concentrates can reach 60–90% THC. A portion the size of a grain of rice is a meaningful dose for most people.
Decoding cannabis potency for your specific needs also means considering whether you want a CBD-rich product to moderate THC’s psychoactive effects, which is a common approach for medicinal consumers managing anxiety or pain.
Several persistent misconceptions lead consumers to make poor purchasing decisions. Knowing what is false is as useful as knowing what is true.
Many retailers and consumers over-rely on THC percentage as a marketing shortcut, which obscures quality and safety factors that actually determine a good experience.
THC potency is a calculated estimate, not a guarantee, and the label percentage is only one of several factors that determine your actual cannabis experience.
| Point | Details |
|---|---|
| Potency is a theoretical maximum | Labels use the formula THC + (THC-A × 0.877), assuming full conversion that rarely occurs in practice. |
| Lab results vary significantly | The same sample can test 5–10 points apart across different labs, making direct comparisons unreliable. |
| Higher THC does not mean stronger effects | Consumers at 16% and 24% THC report similar intoxication, confirming physiology and self-titration matter more. |
| Terpenes shape the experience | Terpene content above 2% is the industry benchmark for meaningful effect contribution beyond THC alone. |
| Read the COA, not just the label | A full Certificate of Analysis shows terpenes, contaminants, and cannabinoid breakdown that the label omits. |
The fixation on THC percentage is, in my view, one of the most counterproductive habits in the cannabis market. Producers compete to post the highest numbers. Consumers shop by percentage as if it were proof of value. And the actual experience gets lost in the noise.
What I have observed is that the most satisfying cannabis experiences rarely come from the highest-THC products. They come from flower that is fresh, properly cured, and rich in terpenes. A 19% strain with a complex terpene profile, good genetics, and careful handling will outperform a 30% product that was harvested early, dried fast, and stripped of its aromatic compounds.
The cannabis tolerance conversation is equally underserved. People who use high-THC products daily are not getting more out of cannabis. They are compensating for downregulated CB1 receptors. A tolerance break of even two weeks can restore sensitivity dramatically, making a modest-potency product feel genuinely effective again.
My honest advice: treat THC percentage as one data point among many. Read the full COA. Pay attention to terpene content. Start with less than you think you need. The consumers who get the most from cannabis are the ones who understand what they are consuming, not the ones chasing the biggest number on the label.
— Juiced
Knowing how to read a potency label is the first step. Knowing how to apply that knowledge when browsing products is the next one.
Greensociety has put together a practical cannabis flower buying guide that walks you through every decision point, from reading COAs to matching terpene profiles to your goals. If you are ready to move from theory to practice, the guide covers how to select cannabis flower online with the same confidence you would have in a physical dispensary. Greensociety’s product listings include detailed cannabinoid and terpene information so you can make informed choices without guesswork at the checkout.
THC potency is the concentration of tetrahydrocannabinol in a cannabis product, expressed as a percentage of total weight. It represents the theoretical maximum psychoactive potential, calculated using the formula THC + (THC-A × 0.877).
No. Research shows consumers using 16% and 24% THC flower report similar intoxication levels. Individual tolerance, consumption method, and terpene content influence the experience more than raw percentage.
A COA is a lab document showing a cannabis product’s full cannabinoid and terpene breakdown, plus contaminant test results. It provides far more useful information than the single THC number printed on a label.
Terpenes do not increase THC concentration, but they shape how THC’s effects are perceived through the entourage effect. Flower with terpene content above 2% is considered well-preserved and typically delivers a richer, more nuanced experience.
Lab results vary due to differences in equipment calibration, sample preparation, and which part of the plant is tested. Producers sometimes select labs that report higher results, a practice known as lab shopping, which inflates label numbers.